DOES U.S. CENSUS DATA PREDICT MBTA BUS RIDERSHIP?
The MBTA follows Title VI of the 1964 Civil Rights Act, which protects individuals from discrimination based on race, color, or national origin. This means that when the MBTA considers service improvements and changes in service, it must make sure that these changes do not have disparate impact on minority populations. In order to evaluate service changes for impacts on minority populations, the MBTA must understand the proportion of riders who are minority on all of its services.
There are currently two primary ways to calculate minority ridership. The MBTA could either conduct a rider census survey to collect demographic information from a sample of riders on each MBTA bus route or station; or the MBTA could use U.S. census data for people within the service areas of various routes to estimate minority ridership. While conducting a rider census survey is preferred, this method is resource and time intensive. U.S. census data is easily accessible and prime for analysis. Thus, this method, if representative, would be useful.
In this project, I sought to understand if U.S. census minority data within MBTA bus service areas was representative of the minority bus ridership on MBTA buses. Essentially this is a question of whether the minority make-up of the people on bus routes matches the minority make-up of the neighborhoods the routes travel through.
The MBTA recently conducted a Rider Census (the results are available here), so I compared the rider census survey data to U.S. census minority population data in MBTA bus service areas.
SUMMARY OF ANALYSIS METHOD
I examined all MBTA bus routes with a daily ridership of over 600 passengers, excluding the Silver Line. The analysis used MBTA Rider Census data, MassGIS bus stop and bus route data and 2010 U.S. census block and population data.
Using network analysis, buffers and selection tools, I created a value for each bus route to demonstrate the disparity between the percentage minority of bus riders and the percent minority living within the buses service area. This value was calculated as “Percentage Minority Riding the Bus (using rider census data)”/ “Percentage Minority living within Bus Service Area (using U.S. Census Data).
CAN U.S. CENSUS DATA PREDICT MINORITY BUS RIDERSHIP?
The study found that the percentage minority riding MBTA buses is higher than the percentage minority living in MBTA bus service areas; t(115) = 12.38, p=.00. On 86% of bus routes, the minority percentage riding the bus was at least 115% of the minority percentage living in the service areas (Figure 1).
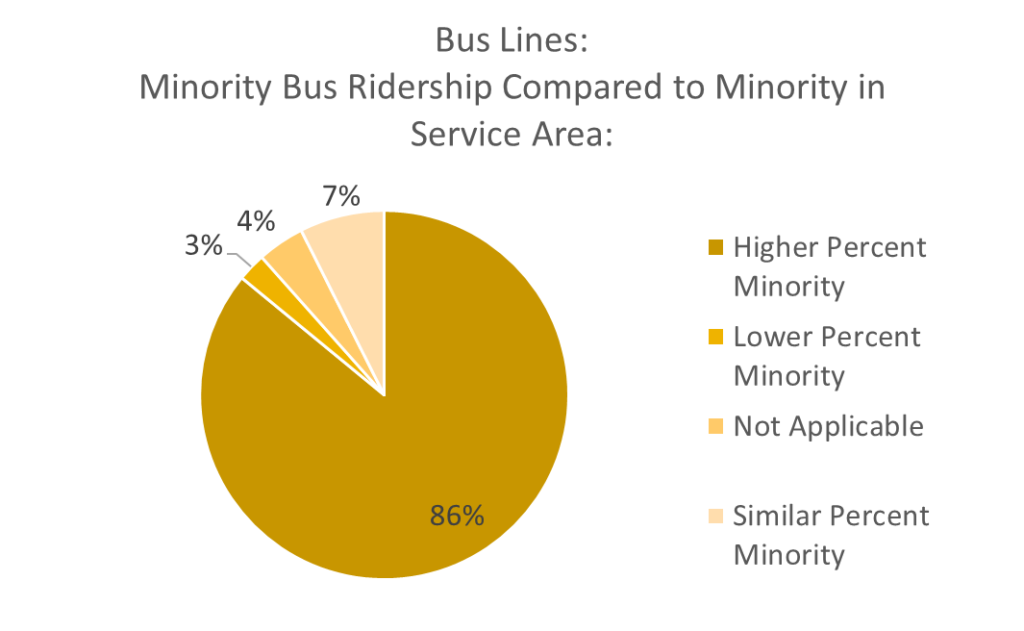
Figure 1
Figure 2 below shows the 7% of MBTA bus routes in blue where the minority population percentage living in the bus service area is comparable to the minority population percentage taking the bus.
Figure 2
For example, on Route 1, the MBTA bus route with the fourth-highest weekday ridership, 36.7% of bus riders are minority; however, only 28.4% of people living in the Route 1 service area are minority. Figure 3 below shows the minority population percentage living within the service area census blocks adjacent to route 1 bus stops.
Figure 3
This analysis also demonstrates where the difference between minority bus ridership and minority residents living in bus service areas is the highest. Figure 4 shows a map of routes where the minority bus ridership is greater (between 100% and 360% of the minority census population percent).
Figure 4
The routes with the highest difference between minority bus ridership and minority population in the service areas are bus routes 350, 134, 76, 230 and 93. On these bus routes, the percentage minority of bus riders is more than three times the percentage of minority residents living in the service areas.
IN CONCLUSION…
Based on this analysis, the minority population living within a bus route’s service area is not representative of minority ridership on buses travelling along the route. The MBTA should continue to use rider census data, instead of U.S. Census data, to estimate minority bus ridership.
To read more about Anna’s project click here. Visit the MBTA Data Blog to enter the current systemwide passenger survey data challenge!