Strategy: Working through data challenges to support urban planning scholarship and professional development

By Ana Paola De La Vega, ‘25
I always envisioned my masters degree as an opportunity to acquire the technical skills needed to assess and respond to the challenges of environmental and urban planning. By the time I had to decide on a research topic for my thesis, I knew that was my main priority: to gain experience deploying the skills I had acquired through my academic program, mainly data analysis, coding and GIS.
I decided to leverage the data collection and analysis work I had done as research assistant to Professor Peilei Fan for the Climate, Land, and Health Outcome of Dengue Fever (CLOUD) for my thesis. The project had received grant funding from the Interdisciplinary Research in Earth Science from the National Aeronautics and Space Administration (NASA) to identify predictive factors and adaptive measures for dengue outbreaks in Peru. My thesis would explore the effects of climate variability and urban infrastructure features on dengue outbreaks in the arid Piura region, as potential drivers of the recent and unprecedented increases in incidence rates.
The first challenge of this research endeavour was navigating a different country’s databases. Peru’s National Center for Epidemiology, Prevention, and Disease Control (CDC) keeps a database of more than twenty years of weekly information on dengue cases at the district level across all Peru and makes the data available for public download. However, population and census data on piped water and sewage systems were not so consistent. By law, Peru’s national population and housing censuses are to be conducted every ten years; in practice, though, the time between censuses has varied due to a history of political instability and caprice. The census data available for my analysis were from 1993, 2005, 2007, and 2017. The results of the most recent census from 2025 had not yet been released, so I couldn’t include them in my analysis. For district-level population counts, the Peruvian National Institute of Statistics and Information Technology’s (INEI) most recent study provided data only for 2018 through 2022.
These data gaps greatly influenced what could and could not be known about dengue incidence risk in Piura. I needed to consolidate a dataset that covered a significant period of time to have confidence in the statistical validity of my results (at least 20 years). I therefore had to rely on various interpolation techniques and data harmonization methods – which was probably the most difficult aspect of my thesis project.
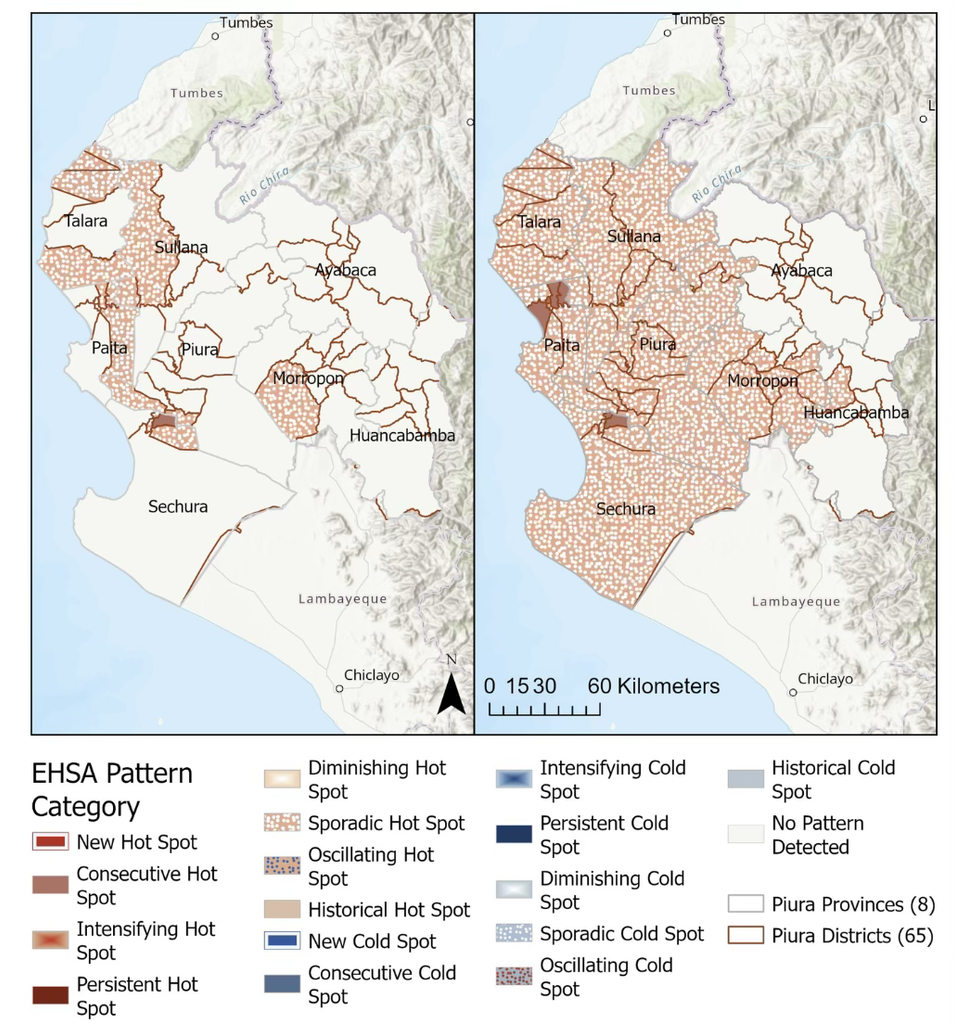
Through the CLOUD project resources we derived more population data points for 2000, 2005, 2010, and 2015 from satellite data and used linear interpolation to fill the missing values between the known years. This was key to adjust earlier census data to correspond with the current administrative divisions using proportional allocation (yes, Piura’s district boundaries had changed over time!). It was also crucial to address the very first research question (what is the historical trend of dengue incidence in Piura, Peru, and how has this incidence been spatially distributed across districts?). The findings of my trend and statistical significance analysis revealed that dengue incidence in Piura had been higher than the national average during the study period (2000-2023) with a clear peak seasonality pattern between the months of March and August. This data also enabled a critical piece of my research: an emerging hotspot analysis revealed that Piura districts had experienced increasingly intense and spatially variable outbreaks, underscoring the need for context-specific approaches to understand the phenomenon.
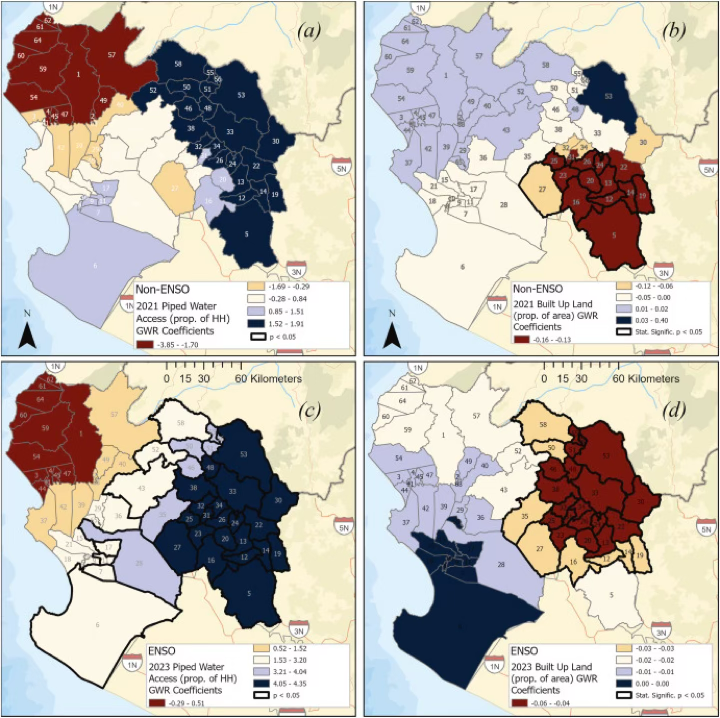
Once I had a panel dataset consolidated with climate and built environment variables , I was able to test their relationship with district-level dengue prevalence in Piura using fixed effects econometric modeling and geographically weighted regressions (GWR). Most of the results were consistent with what the academic literature had suggested on this topic, but there was one important contrast.
While the literature I reviewed largely indicated that urban features such as piped water and sewage access act as dengue transmission mitigators (since these reduce the tendency to store water in containers that become breeding grounds for mosquitoes), my findings suggested that access to piped water had positive and significant effects on dengue prevalence in the fixed effects model and positive and sometimes significant effects for some districts in the GWR models (De La Vega, A.P., et. al., 2026).
This took me back to the question of what is and is not knowable from available data. My piped water access variable was derived from a census question on the existing types of water supply in a household. The data reflects the presence of certain systems or infrastructure, but it does not say anything about other dimensions of water access, such as quality, reliability and affordability. This means that the water storage practices that facilitate dengue transmission may persist despite the introduction of piped water as adaptations to unreliable water systems, whether due to drought conditions or urban infrastructure failure.
This research journey helped me consolidate the skills I was looking to acquire. Having the experience of analyzing complex datasets with practical urban planning applications is proving very useful now that I work as a senior analyst in the City of Boston’s Environment Department. It has also become one of my greatest academic accomplishments as I used my thesis work to write an article now published in the academic journal Applied Geography! (Check it out here).
In addition to supporting my personal and professional growth, I think my experience working with data for my thesis holds lessons for urban planning research and development more broadly. Data gaps are an important barrier for more robust modelling. I would have loved to integrate other variables suggested in the literature, like human mobility, road infrastructure and international air travel. But the reality is that maintaining data infrastructure is demanding and costly for low- and middle-income countries. This does not make the cities in these countries any less worthy of study (quite the contrary!), but it does demand that we make more assumptions and thoughtfully deploy data analysis techniques to develop provisional answers. In fact, oftentimes we don’t need more data points but rather comprehensive research approaches that reflect how data relates to people’s lived realities, including their behavioural patterns and adaptive mechanisms in the face of changing climate patterns and complex urban dynamics.
References:
De la Vega Núñez, Ana Paola. “Dengue Outbreaks on the Rise: A Statistical and Spatial Analysis Approach to Dengue Incidence, Climate and Environmental Patterns, Drivers and Implications in Piura, Peru.” Order No. 32167263 Tufts University, 2025. United States — Massachusetts: ProQuest. Web. 21 Sept. 2026.
De La Vega, A. P., Fan, P., Singh, S. K., & Davis, M. (2026). Climate, built environment, and dengue prevalence: Patterns, drivers, and policy implications in Piura, Peru. Applied Geography, 196, Article 104168. https://doi.org/10.1016/j.apgeog.2026.104168
Further Reading:
- Read the full Master’s Thesis here: Dengue Outbreaks on the Rise: A Statistical and Spatial Analysis Approach to Dengue Incidence, Climate and Environmental Patterns, Drivers and Implications in Piura, Peru
- Research Article: Climate, built environment, and dengue prevalence: Patterns, drivers, and policy implications in Piura, Peru
- Exemplary Thesis Library